

Author: René D. Garreaud, Deputy Director of the Center for Climate and Resilience Science (CR2)
Editor: José Barraza, Science Communicator at CR2
The rainfall that fell over central Chile in June 2023 and June 2024 was similar and immense—equivalent to approximately 200 El Yeso reservoirs. However, the spatial and temporal distribution differed. The meteorological conditions in these months largely determined the social impact of these events.
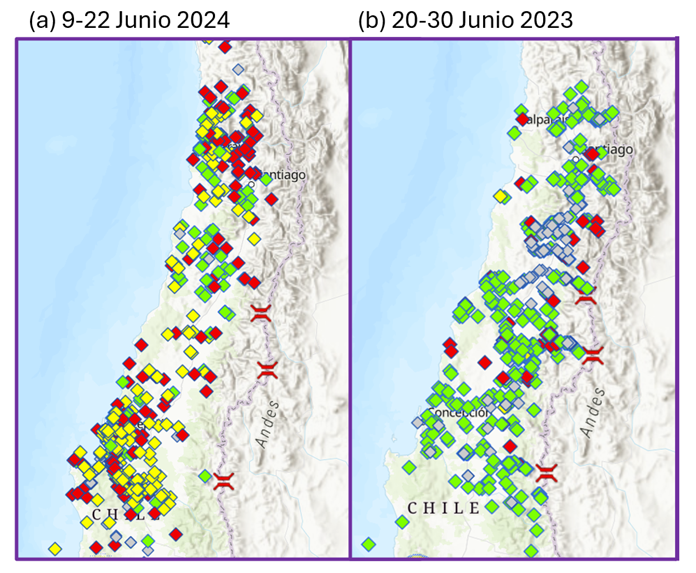
A sequence of frontal systems affected central Chile during June 2024, resulting in one of the rainiest months on record and significant social impacts between the Coquimbo and Araucanía regions, particularly impacting the coastal area of the Biobío region. The magnitude and extent of the disaster prompted the Government to declare a catastrophe zone between Coquimbo and Ñuble on June 12 of this year. According to Senapred reports from June 16 and 23, 2024, the storms damaged over 11,000 homes and caused massive power outages. On certain days, over 3,000 people were reported as isolated. The Ministry of Public Works’ emergency viewer reported dozens of road and bridge closures, especially in the coastal areas of Biobío and Valparaíso (Figure 1a).
How much, where, and how did it rain?
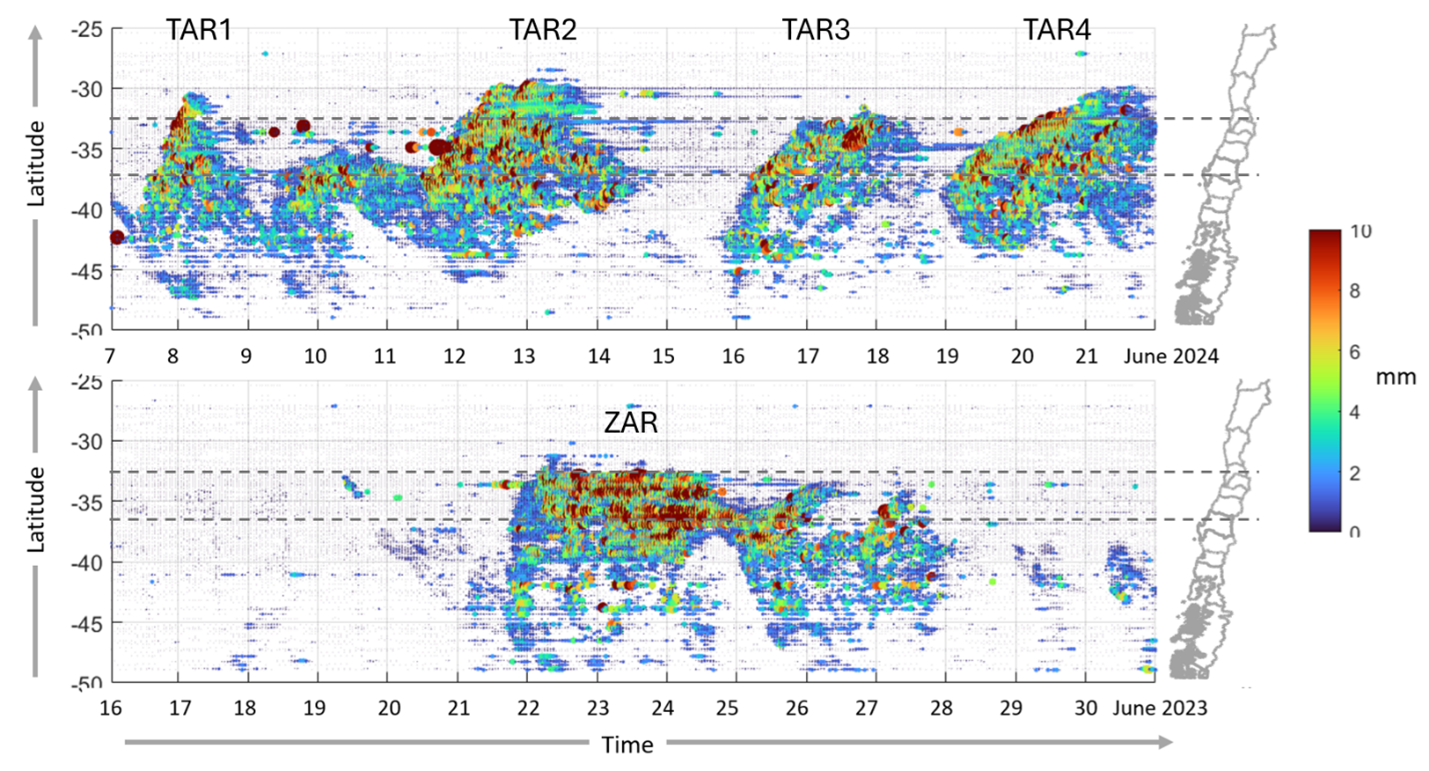
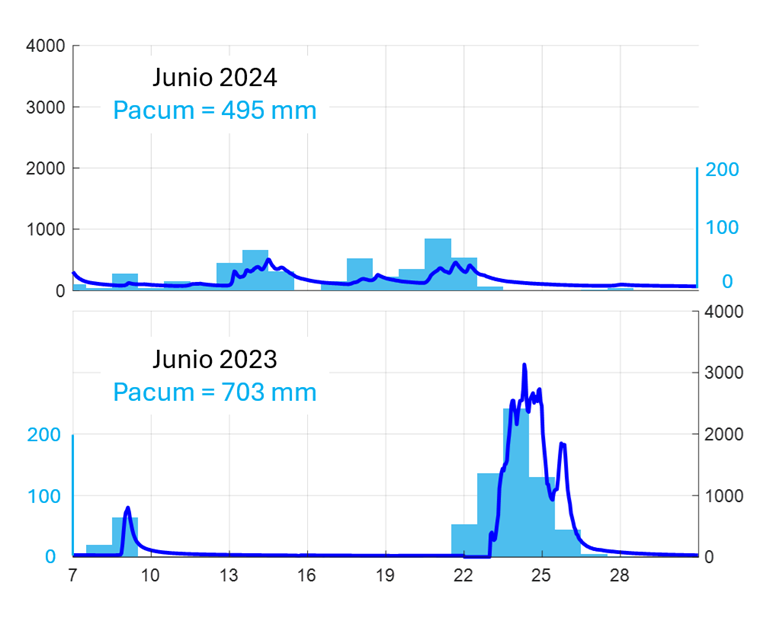
The upper panel of Figure 2 shows precipitation evolution between June 7-21, 2024, using hourly rainfall intensity (color scale in millimeters per hour) at stations across central Chile. In this time window, precipitation appeared in the Los Lagos region (between 45-40°S) on June 7, advancing northward to reach the Coquimbo region (30°S) at the beginning of June 8. Subsequently, three precipitation pulses can be distinguished, starting in the southern zone and moving northward, albeit with different reaches. Considering the Biobío region (36.6°S, indicated by dashed lines), the most significant precipitation occurred on June 8, 10, 11, 12, 16, 19, and 20.
In some stations in the Araucanía region, rains began in the last week of May and persisted for over three weeks, except for a break on June 16 (Mauricio Zambrano, personal communication). Intensities exceeding 10 mm/hour (intense rainfall by our standards) were observed at multiple stations throughout this precipitation period.
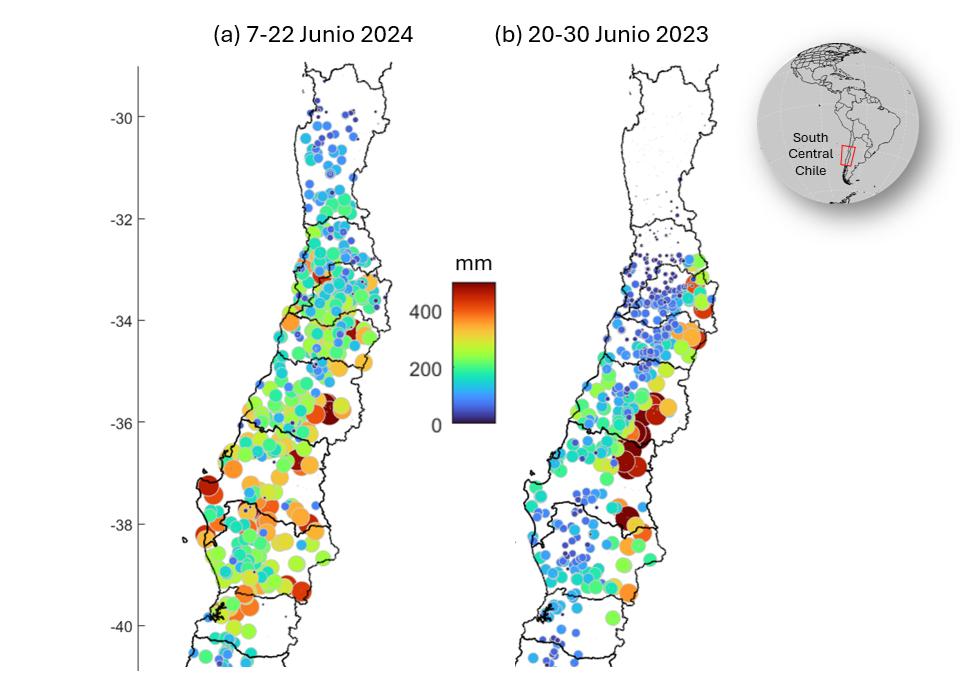
The accumulated precipitation between June 7-21, 2024, is presented in Figure 3a, using the same set of stations as in the previous figure. Values above 200 mm predominate between the Valparaíso and La Araucanía regions. The precipitation distribution is relatively uniform, with a moderate increase towards the foothills, although accumulations over 300 mm are observed in the Andes foothills in the Maule region. Also notable are the substantial accumulations on the coast of Biobío (such as 394 mm in Concepción) and Valparaíso (353 mm in Rodelillo).
A year ago…
At the end of June 2023, we commented on the return of the giants due to another exceptionally rainy period in central Chile. The lower panel of Figure 2 shows the latitude-time diagram between June 16 and 30 of that year, where a single precipitation event is observed that began on the 22nd and extended up to six days in some stations. In contrast to the 2024 storms, the 2023 pulse began more or less simultaneously between the Los Lagos and Metropolitan regions (45-33°S) and then the most intense precipitation, with accumulations over 10 mm/hr, remained stationary between the O’Higgins and Ñuble regions.
The differences between June 2023 and 2024 are also observed in the spatial distribution of precipitation. The 2023 accumulations comprise a smaller latitudinal range, with the absence of rain north of 33°S; moreover, they show a marked topographic enhancement, as in the Maule, Ñuble, and Biobío regions, accumulations on the coast and central valley fluctuated between 100 and 150 mm, while in foothill sectors they exceeded 500 mm, reaching 700 mm at the Bullileo Reservoir station. These accumulations were concentrated in a 72-hour period and a warm environment, giving rise to large-magnitude floods in the Andean rivers. This subsequently generated extensive flooding in the central valley and coastal sectors adjacent to river courses. Consistent with this, the MOP emergency viewer shows that most road and water infrastructure damage was concentrated in the central valley and foothills in the Maule and Ñuble regions (Figure 1b).
The TAR family and the solitary ZAR
Considering the area of central Chile between Coquimbo and La Araucanía, the rain that fell in 2023 and 2024 was 50 billion cubic meters, enough to fill about 200 reservoirs the size of El Yeso. These are extreme and similar values but the product of very different conditions.
The four precipitation pulses of 2024 (Figure 2) were due to the passage of cold fronts over central Chile. Each front occurred connected to a low-pressure center [2], moving in mid-latitudes from the Pacific towards South America. Figure 4 shows an example of this situation on June 20, 2024, where the letter B indicates this low-pressure center. Meanwhile, the cloudiness allows for inferring the approximate position of the cold front that caused rains over Biobío. Ahead of the cold front, there is a corridor of intense low-level winds that transport humidity from subtropical latitudes southward. When this transport is intense and concentrated in a long but narrow band, we refer to it as an atmospheric river (AR). All June 2024 events presented an AR, with the case of June 11 and 12 being particularly intense (Figure 5a), which, due to its intensity and persistence, qualified as a category 4 river (on the 1-5 scale of Ralph et al., 2019). Notably, the vapor transport in the 2024 events came from the northwest (NW), forming an angle of about 45° with the Andes Mountains. These cases are called tilted atmospheric rivers (TAR) and are the most frequent during the winter in central Chile.

The article “Atmospheric Rivers in South-Central Chile: Zonal and Tilted Events” documents that NW winds during TARs tend to produce the most significant precipitation in the coastal mountain range, an orographic shadow (decrease in precipitation) over the central valley, and a moderate increase in precipitation over the Andes Mountains, due to the marked blocking it produces on the humid air attempting to cross it. Additionally, a good part of the precipitation during TARs tends to occur when the temperature begins to decrease – in connection with the arrival of the cold front – which favors snow accumulation on the Andes Mountains above 2000 m in altitude. These are precisely the ingredients that were observed during the June 2024 storms. However, the persistence of a TAR over the Biobío coast, the incredible intensity of rain in specific coastal sectors, and the effect of northern solid wind in the coastal strip have not yet received sufficient attention.
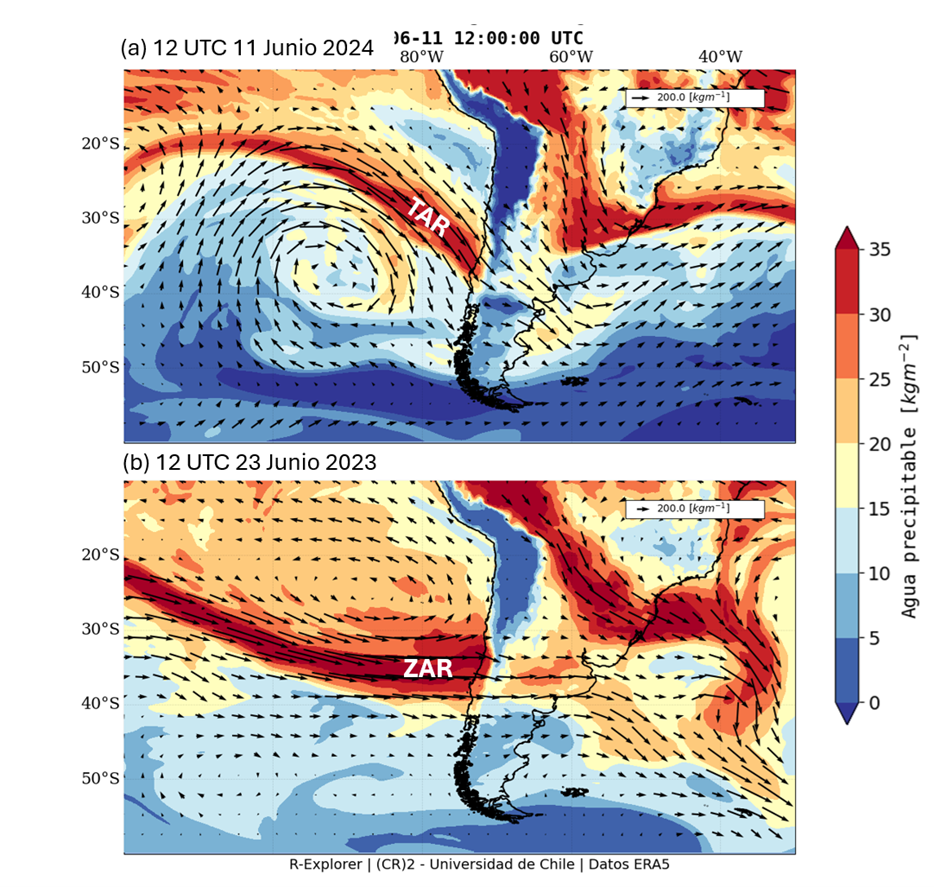
In contrast, the storm that occurred between June 22 and 26, 2023 was the product of a zonal atmospheric river (ZAR; Garreaud et al., 2024) immediately ahead of a stationary front. The ZAR arrived at the coast of the Los Ríos region and then moved slowly northward, remaining centered in the Maule region between June 23 and 25 (Figure 5b). Under these conditions, a strong moisture flow perpendicularly impacted the Andes, and the ascent concentrated on the foothills, where the most significant precipitation occurred.
Another marked difference with the 2024 TARs is that precipitation during the solitary ZAR occurred in a warmer environment, leaving snow above 3200 meters in altitude. Thus, the Andean basins quickly received a large amount of liquid precipitation, generating a much more marked hydrological response. For example, Figure 6 compares the hourly flow values of the Achibueno River at La Recova (about 20 kilometers inland from Linares) during June 2024 and 2023, along with daily precipitation values at the nearby Juan Amigo station.
In the case of 2024, the 475 mm accumulated were distributed over several days (with intensities below 100 mm/day) and caused maximum flows close to 500 m3/sec. In contrast, the 2023 ZAR accumulated over 700 mm in its five days of duration, with a maximum of over 200 mm/day, increasing the flow up to 3200 m3/s with an estimated return period of at least 50 years.
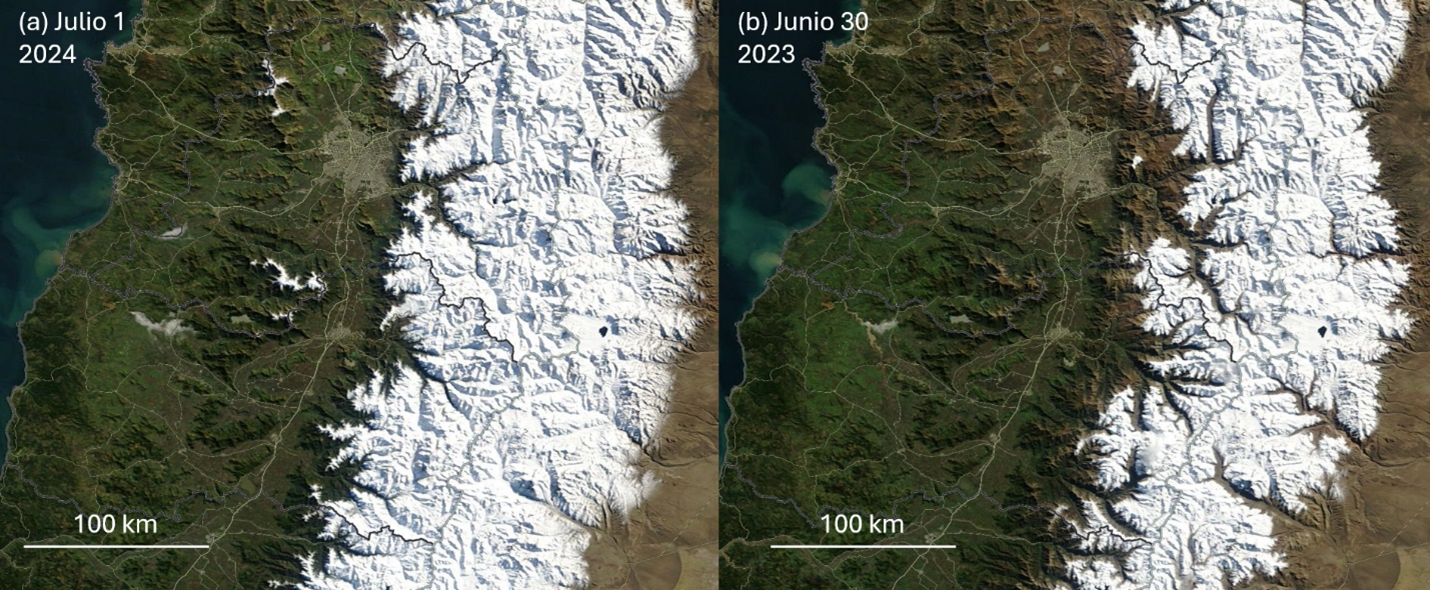
The snow cover at the end of June is relevant, as it determines the water resources available for the summer. Due to the difference between the thermal conditions of the storms already described, the current snow cover (as of July 1) is substantially greater than its counterpart from a year ago, as seen in the satellite images in Figure 7. As an example, the Tinguiririca River basin (east of San Fernando in the O’Higgins region) currently has 92% of its area covered by snow, in contrast to the 52% it presented a year ago, according to data from the Andean Observatory based on MODIS images.
And what happened with La Niña?
During 2023, an intense El Niño event developed, characterized, among other aspects, by the warming of the sea surface in the equatorial Pacific. In June of that year, this warming extended from the coast of South America to the dateline (Figure 8a) and probably contributed to the rainfall surplus observed in central Chile. This El Niño event culminated at the end of 2023 and beginning of 2024, when the Niño 3.4 index reached 2°C. However, in January, climate prediction models indicated a rapid transition towards a cold condition in the tropical Pacific by the middle of this year. In February, the consolidated forecast from the Interamerican Research Institute indicated a 50% probability of La Niña occurrence for the June-July-August (JJA) quarter and 65% for the July-August-September (JAS) quarter. As La Niña is associated with a deficit precipitation condition in central Chile, various press notes appeared predicting an extremely dry condition for the current winter. However, the seasonal precipitation forecast in central Chile has multiple uncertainties, and even with an accurate prediction of La Niña, it is not possible to predict the intensity of precipitation anomalies (read this CR2 Analysis) as we are currently seeing.
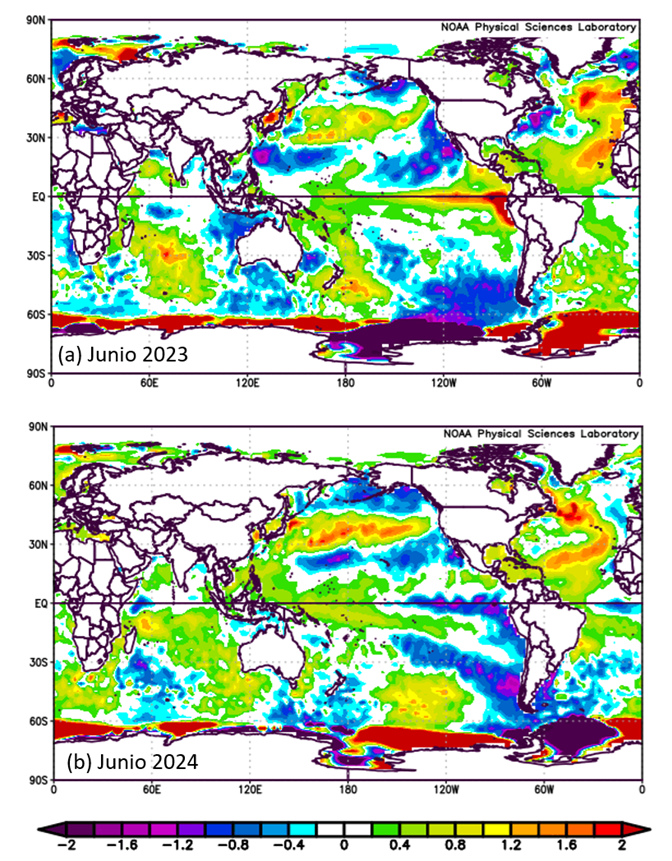
Although the cooling of the tropical Pacific began markedly on the South American coast, its extension to the west has been slower than anticipated, as indicated by the sea surface temperature (SST) anomaly map for June 2024 (Figure 8b) and a Niño 3.4 index still above 0°C. The Interamerican Research Institute forecast issued in mid-June 2024 reduced the probability of La Niña to 13% for the JJA quarter and 32% for JAS. Dynamic prediction models were also unable to foresee the establishment of a high-pressure center (blocking high) west of the Antarctic Peninsula that persisted for much of June and played an essential role in that month’s rainfall, as we will describe later.
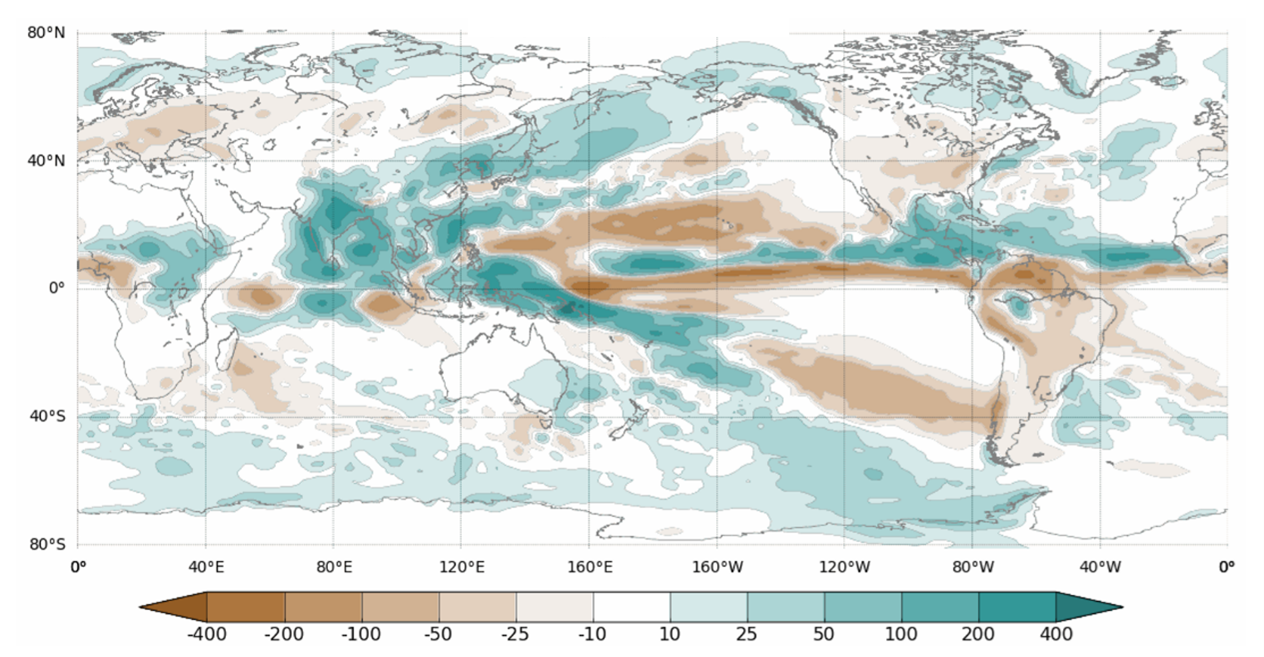
Thus, the most recent information and predictions indicate that most of the present winter will be under a neutral condition of the El Niño Southern Oscillation (ENSO), where, historically, a rainfall deficit or surplus can occur in central Chile with the same chance, due to the influence of large-scale factors such as the Madden-Julian Oscillation or the Southern Annular Mode described in this previous Analysis. However, in the last twenty years, the relationship between ENSO and precipitation in central Chile has weakened, and most neutral years have ended in deficit rainfall conditions, including the megadrought period 2010-2022. Climate change and the warm blob in the southwestern subtropical Pacific are possible explanations for this. These additional factors to ENSO are considered by global climate models that serve as the basis for climate prediction and show a deficit precipitation condition for much of central Chile (Figure 9) during the JAS quarter. Even if this is fulfilled, the precipitation accumulation to date will result in an average or above-average year between the Valparaíso and La Araucanía regions.
Broadening the view [4]
In this last section, we present a hemispheric view that helps understand the rainfall anomalies in June 2023 and 2024.
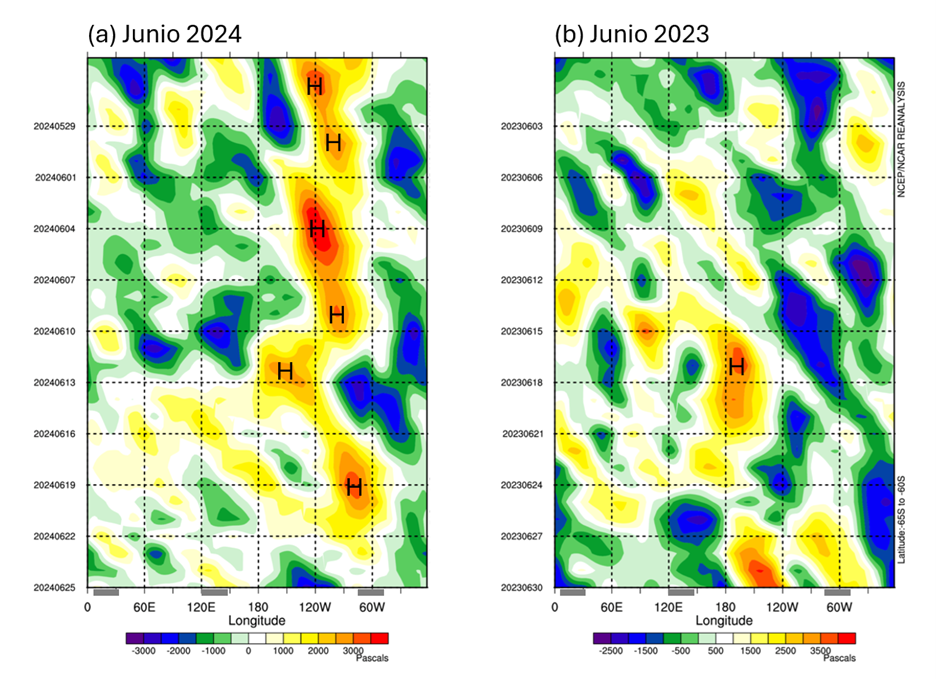
We will start with the mean circulation between June 5 and 14, 2024, when the first two TARs arrived in central Chile. Figure 10a shows the average stream function anomalies at 200 hPa, which can be interpreted as pressure anomalies in the upper troposphere during this period. In the high latitudes of the South Pacific, an anticyclonic anomaly (red letter H) stands out throughout the tropospheric column. As shown by the time-longitude section at 60°S of surface pressure anomalies, this anomaly persisted for much of June near 120°W (Figure 11a). This blocking high over the Amundsen-Bellingshausen Sea was able to divert the storm track northward, as seen in the succession of opposite-sign anomalies in subtropical latitudes over the southeastern Pacific. The cyclonic anomalies (letter L; positive contours) at height are dynamically linked to depressions near the surface, which favored the formation of fronts and ARs that reached central Chile.
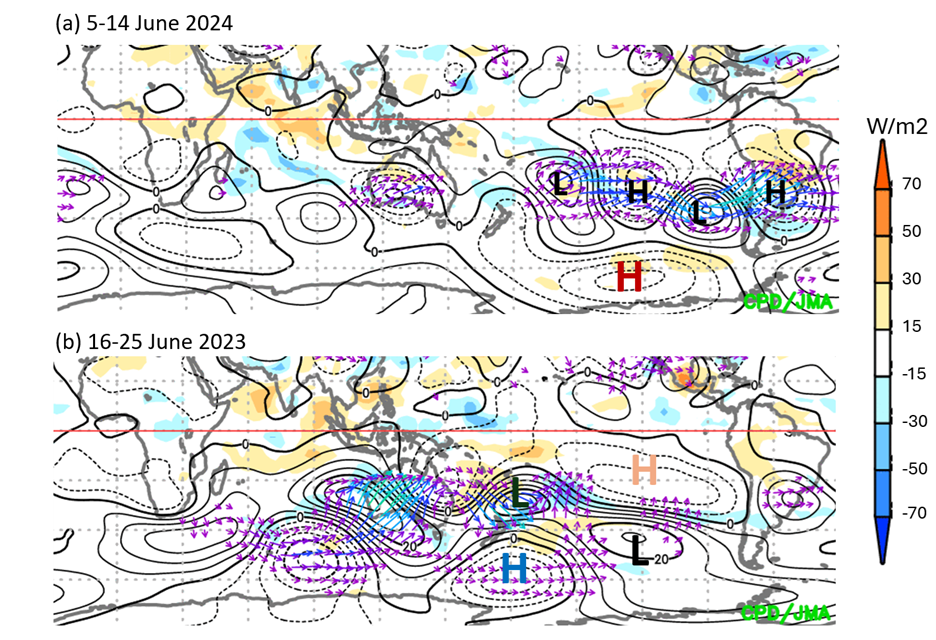
Figure 10b shows the same field of stream function anomalies for the ten days prior to the zonal atmospheric river (ZAR) ‘s occurrence in June 2023. As in 2024, the condition was quite stationary, but with a spatial pattern consistent with a quadrupole (two centers of cyclonic anomaly, identified with the letter L, and two anticyclonic, identified with the letter H) over the South Pacific, which is recurrent in ZAR cases (Valenzuela et al., 2021; Garreaud et al., 2024).
At the same time, near New Zealand, there is a blocking anticyclone at high latitudes (Figure 11b) and a cyclonic anomaly at lower latitudes. These height anomalies extend to the middle and lower troposphere. The anticyclone transported cold air northward, contributing to forming a westerly wind jet stream at subtropical latitudes. For its part, the cyclonic anomaly at lower latitudes transported moist air towards the base of the jet stream, thus feeding the ZAR (Mudiar et al., 2024). In addition to this, near South America, a reinforced subtropical anticyclone and a cyclone at higher latitudes were observed, which favored the extension of the subtropical jet stream and the ZAR until reaching the coast of Chile.
Although in June 2024 ENSO was transitioning towards the La Niña phase, while in June 2023 El Niño was developing, both months presented positive anomalies in sea surface temperature in the western sector of the tropical Pacific (Figure 8), with an extension towards the southeast in the form of a band reaching 15°S-120°W. These warmer-than-average conditions may have been partly responsible for the previously described circulation patterns and undoubtedly contributed to the atmosphere over that sector of the South Pacific having more water vapor than an average June. It is possible that part of this moisture fed the storms that eventually reached central Chile (Campos & Rondanelli, 2023; Mudiar et al., 2024).
References
Campos, D., & Rondanelli, R. (2023). ENSO‐Related Precipitation Variability in Central Chile: The Role of Large Scale Moisture Transport. Journal of Geophysical Research: Atmospheres, 128(17), e2023JD038671. https://doi.org/10.1029/2023JD038671
Garreaud, R. D., Jacques-Coper, M., Marín, J. C., & Narváez, D. A. (2024). Atmospheric Rivers in South-Central Chile: Zonal and Tilted Events. Atmosphere, 15(4), 406. https://doi.org/10.3390/atmos15040406
Mudiar, D., Rondanelli, R., Valenzuela, R. A., & Garreaud, R. D. (2024). Unraveling the dynamics of moisture transport during atmospheric rivers producing rainfall in the Southern Andes. Geophysical Research Letters, 51(13), e2024GL108664. https://doi.org/10.1029/2024GL108664
Ralph, F. M., Rutz, J. J., Cordeira, J. M., Dettinger, M., Anderson, M., Reynolds, D., … & Smallcomb, C. (2019). A scale to characterize the strength and impacts of atmospheric rivers. Bulletin of the American Meteorological Society, 100(2), 269-289. https://doi.org/10.1175/BAMS-D-18-0023.1
Valenzuela, R., Garreaud, R., Vergara, I., Campos, D., Viale, M., & Rondanelli, R. (2022). An extraordinary dry season precipitation event in the subtropical Andes: Drivers, impacts and predictability. Weather and Climate Extremes, 37, 100472. https://doi.org/10.1016/j.wace.2022.100472
Notes
[1] This analysis does not consider a fifth frontal system that affected the area between the Los Lagos and La Araucanía regions in late June 2024.
[2] Low-pressure center, depression, or extratropical cyclone.
[3] The historical probability of each ENSO phase (La Niña, Neutral, or El Niño) is 33%.
[4] This is a rather technical section.
Editor’s note:
Figure 3 and its interpretation were modified due to a date correction. It previously stated: *Accumulated precipitation at stations in central Chile (DGA, DMC, and Agromet) during the period (a) June 7-22, 2023, and (b) June 20-30, 2024*. Hourly data from DMC, DGA, CEAZA, Agromet, and RedMeteo were obtained from VisMet. It now states: *(a) June 7-22, 2024, and (b) June 20-30, 2023. *


